
British Columbia’s capital, Victoria, is a community of choice among various individuals because of its natural wonders, recreational sites, temperate climate, and economic opportunities. Victoria is blessed with natural and human-made riches including heritage architecture, ocean views, and mountain vistas that make is a destination of choice for travellers.
Demographic Data
Population
Results of a 2016 census showed an increase of 7.2% in 2016 with 85,792 against 80,017 in 2011. Out of the total population, 59,810 or 69.7% belong to the age group of 15 to 64 years old, with the average and median age of the community are 44 and 42 years old, respectively.
Income
According to Statistics Canada, the total income of individuals for 2015 is $73,745 with median total and average total income among recipients at $34,164 and $43,934 respectively. As for private household income, the total income for 2015 is $45,765 with median total income of households at $53,126 and average total income at $69,383.
Education
There are 73,745 individuals, 15 years and older, with an educational background. Below is a summary of their major fields of study.
- Visual and Performing Arts and Communication Technologies – 2,950
- Humanities – 4,065
- Social and Behavioral Sciences and Law – 8,170
- Business Management and Public Administration – 8,260
- Physical and Life Sciences and Technologies – 2,335
- Mathematics, Computer and Information Sciences – 1,845
- Architecture, Engineering, and Related technologies – 5,475
- Agriculture and Related Sciences – 1,005
- Health and Related fields – 7,390
- Personal, Protective and Transportation services – 2,505
Employment Rate
Victoria recorded the 2nd lowest employment rate as of August 2019 at 3.3%, behind only Quebec City which is at 2.6%. Employment in Canada has seen slight increases in business, building and other services, transportation and warehousing and professional, scientific and technical services, though the bulk of the jobs created were part-time, service sector taken mostly by young people.
Economic Standing
Gross Domestic Product
British Columbia led all provinces in growth in 2016 and 2017. The BC economy slowed its place last year, although still at a respectable rate of 2.3% (third-fastest among regions). The Gross Domestic Product of the area is forecast to grow by 2.4% this year, while Victoria’s inflation rate is at 2.4%.
Real Estate Trends
Housing Summary
Numbers have been trending slightly upwards compared to last year. Victoria Real Estate Board President Cheryl Woolley attributes this to the market, slowly adjusting to government changes like the B20 mortgage stress test and low mortgage interest rates. “It is a good time to buy and sell as consumers have more time to work with their REALTORS® and make decisions. We’ve seen a little more inventory added to the market compared to last year, which means more choice for buyers.”
Pricing
As of August 2019, the Multiple Listing Service (MLS) Home Price Index benchmark value for single-family homes in the Victoria Core is at $847,300, which represents a decrease of 4.6% from the previous year’s benchmark value of $888,100, and a decrease of 1.6% of the prior month’s amount of $858,000.00. On the other hand, the benchmark value for condo apartments in the Victoria Core is at $518,100, an increase of 2.9% from the previous year’s benchmark value of $503,600, and a decrease of 1.0% from last month’s amount of $523,400.
Vacancy Rates
The rental sector showed a trend of increasing vacancy in 2017 and 2018, which showed more rental units introduced to the market. Nevertheless, the rental industry in Victoria remains to be robust, given that the vacancy rate as of October of 2018 was at 1.1%.
| Vacancy Rates – Actual and % Change | ||||||
| – | – | – | – | – | – | – |
| CIty | 2013 | 2014 | 2015 | 2016 | 2017 | 2018 |
| Vancouver | 1.7 | 1.0 | 0.8 | 0.7 | 0.9 | 1.0 |
| Victoria | 2.8 | 1.5 | 0.7 | 0.5 | 0.7 | 1.1 |
| Average | 2.3 | 1.3 | 0.8 | 0.6 | 0.8 | 1.1 |
| City | 2013 | 2014 | 2015 | 2016 | 2017 | 2018 |
| – | – | – | – | – | – | – |
| Vancouver | -41.18% | -20.00% | -12.50% | 28.57% | 11.11% | |
| Victoria | -46.43% | -53.33% | -28.57% | 40.00% | 57.14% | |
| Average | -44.44% | -40.00% | -20.00% | 33.33% | 31.25% | |
Sales
The Victoria Real Estate Board reported a total of 661 properties sold in August 2019, which represents a growth of 11.3% versus the previous year’s performance of 594 properties sold. However, the August figure is lower than that of July 2019 by 6.4%. Sales of condominiums were up 4.1% from August 2018 with 203 units sold. Sales of single-family homes increased 15.5% from August 2018 with 351 sold.
Building Permits
Quantity of Building Permits
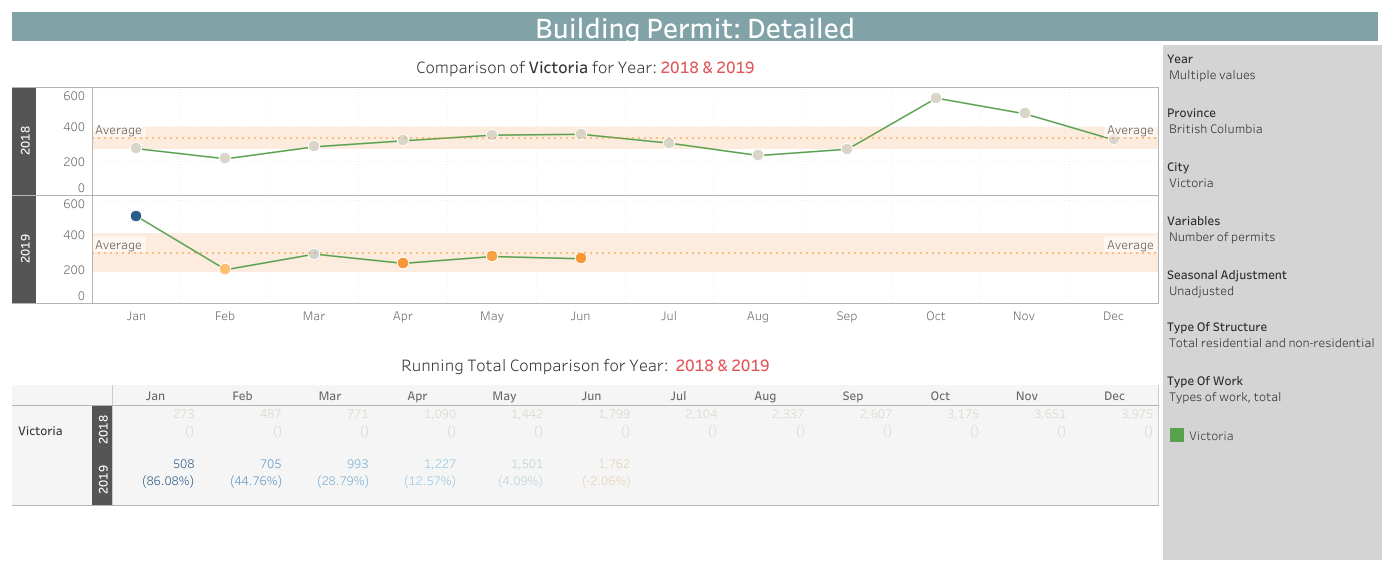
In the 1st half of 2019, the British Columbia capital issued 1,762 building permits, down 2.06% from the same period of the previous year. January saw the most number of building permits issued, with 508, which is 86.1% higher than that of the past year. Licenses issued dropped by 61.2% in the following month to 197, and settled between 233 to 288 for the remainder of the 1st semester, showing a generally flat trend for the number of building permits issued.
Value of Building Permits
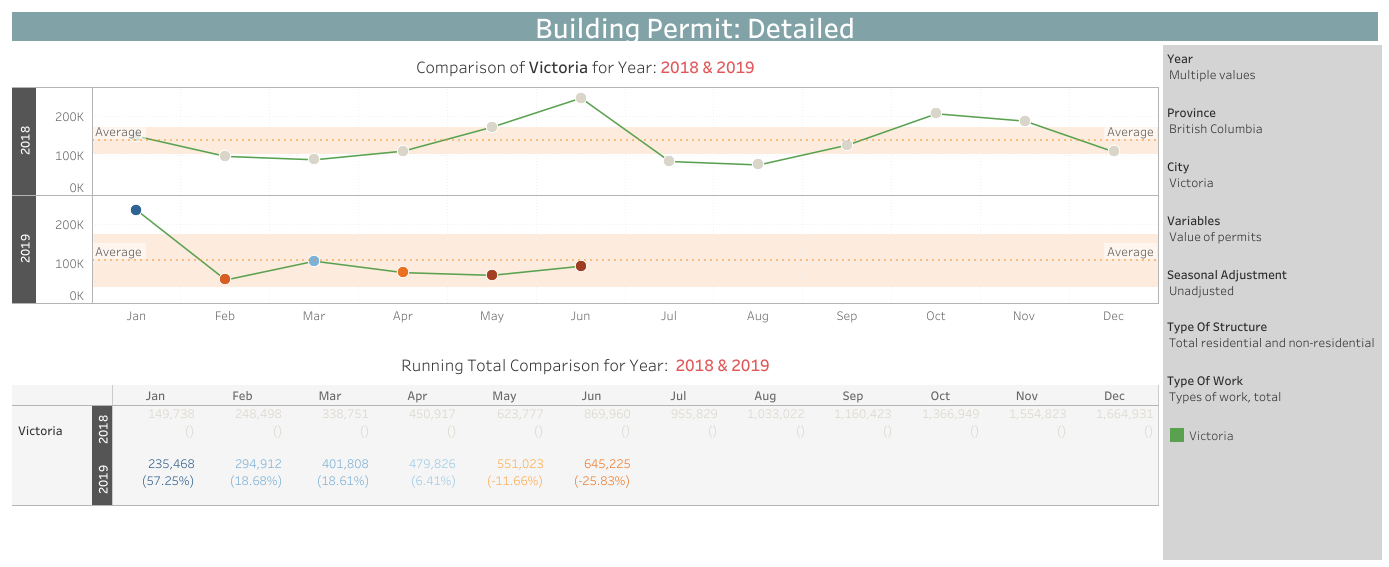
The 1st semester of 2019 generated a total of $645 million worth of building permits, which is 25.8% lower than the same period of the previous year. January alone brought in 36% of the value with $235 million of building permits. The amount was also the 2nd highest total seen in the last 12 months and represents an increase of 57.3% versus the previous year. However, this value dropped by 75% in the following month and remained relatively flat after a slight recovery in March as building permit values ranged from $60 million to $100 million.
Housing Starts
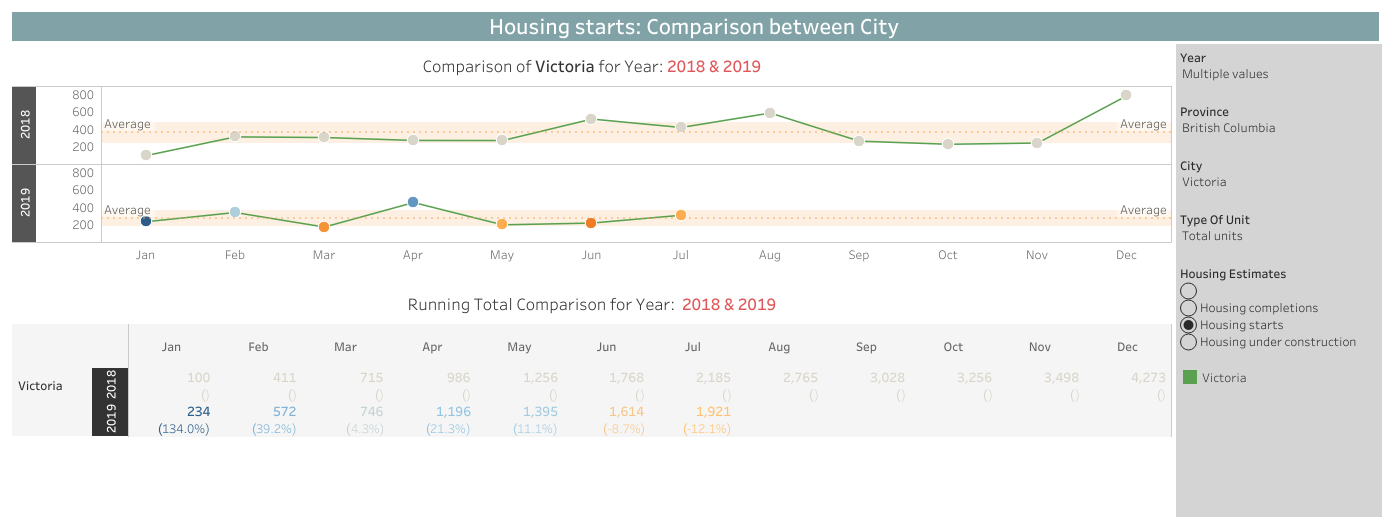
A total of 1,921 housing units started construction as of July 2019, lower by 12.1% versus the previous year. On a month-to-month basis, housing starts averaged a total of 274 per month, which dropped to 174 in March but recovered in April with 450. Notwithstanding the mentioned months, housing starts ranged between 200 to 300 units indicating a generally flat trend. The year-to-date average of 274 is 23% lower than the full year 2018 average of 356 units, which saw a peak of 775 housing starts in December of 2018.
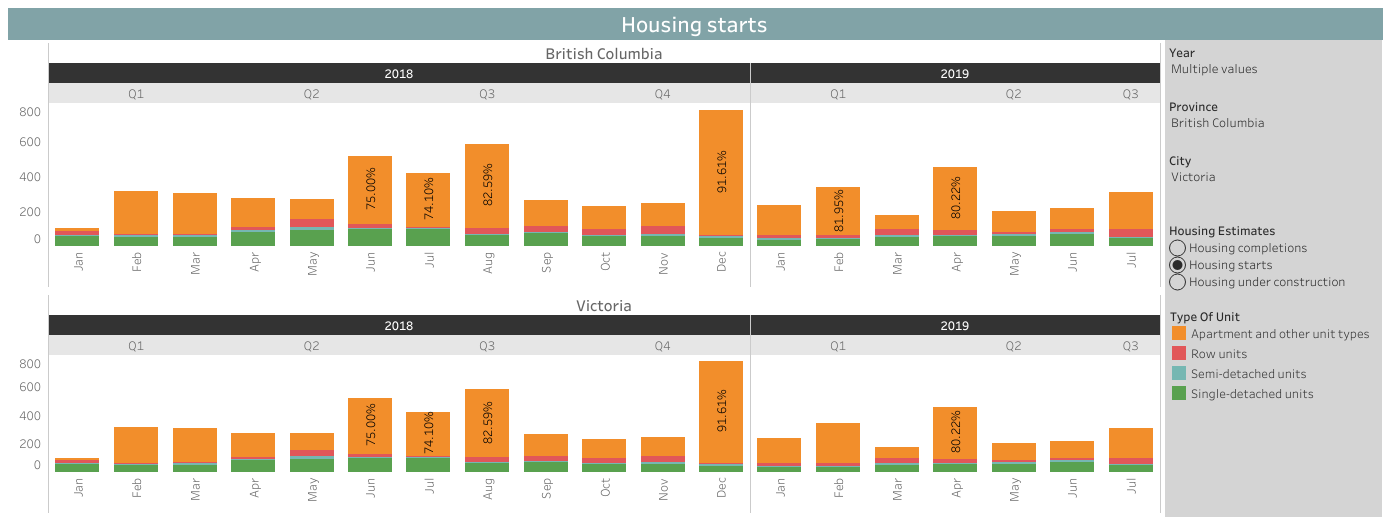
Apartments comprised the most significant percentage of housing starts in Victoria at 69.7%. Single-detached units followed, with 18.2% of 2019 housing starts. Row units and semi-detached units were at 8.54% and 3.64% respectively. These proportions were consistent with trends exhibited in 2018.
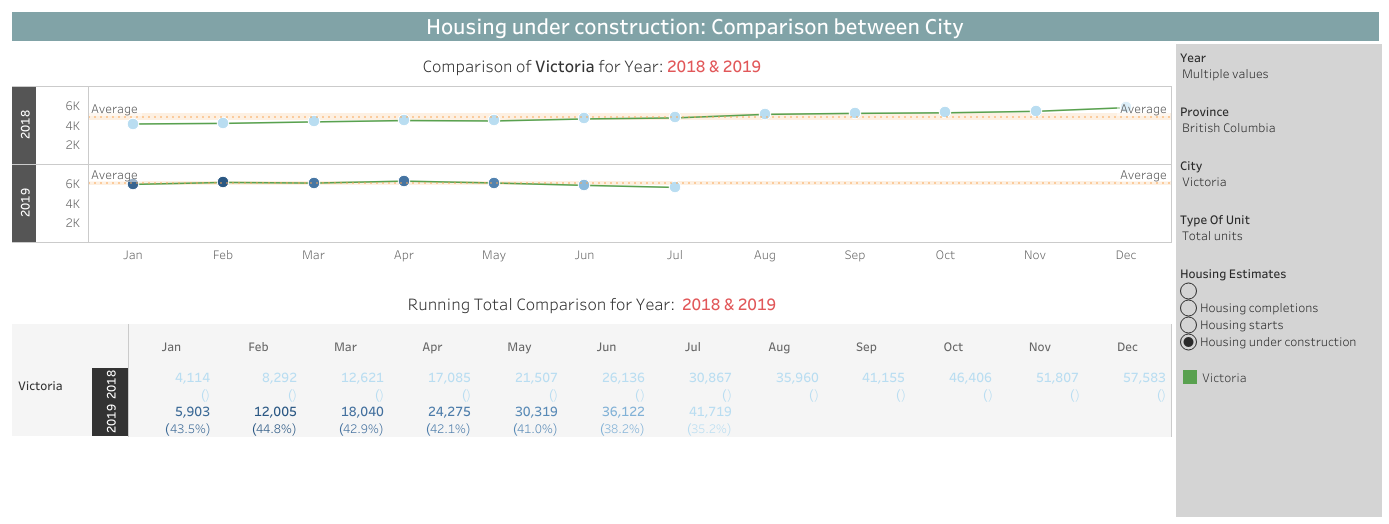
Under Construction
The growth of inventory of housing under construction has been constant since the beginning of 2018. A total of 4,114 units were undergoing development as of January 2018. In January of 2019, there were 5,903 housing units under construction showing a 43.5% growth versus the previous year. This trend peaked in April of 2019 with 6,235 housing units under construction. The number of units under construction began to taper slowly, reaching 5,597 units under development by the end of July. The reduction in the volume of units under construction indicates that developers recognize that this inventory might be too large, and have responded by reducing the pace of building permits acquired and housing starts.
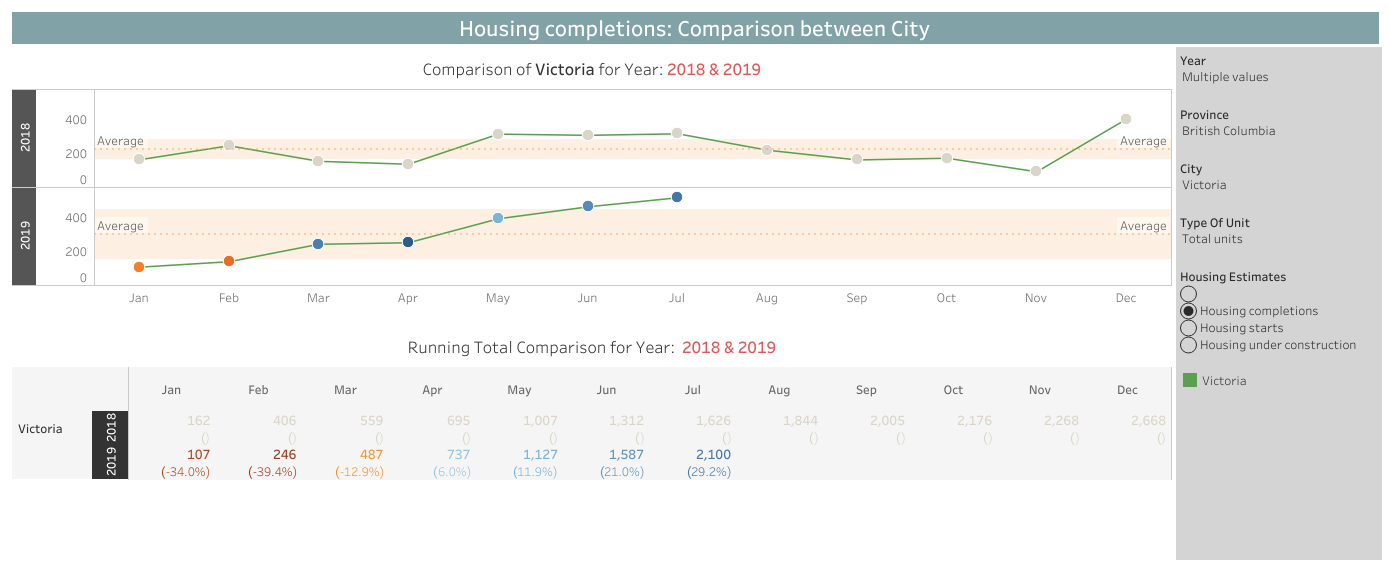
Completions
As of July 2019, 2,100 housing units were delivered, 29.2% higher than that of the previous year. The year-to-date total represents 78% of the full-year total of 2018. The rate of completions has also continuously grown in 2019. A total of 107 units of housing were completed in January, and increased consistently throughout the ensuing months, with housing completions in July reaching 513 units.
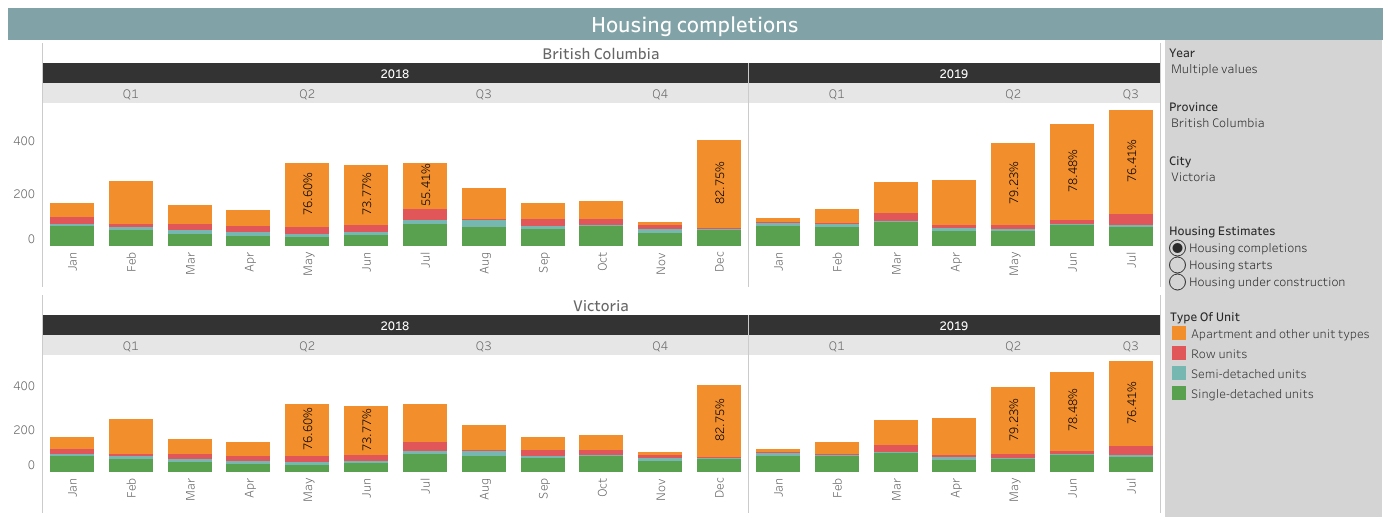
Of the 2,100 housing units completed, 67.6% of these or 1,420 were apartments or other unit types while there were 505 were single-detached homes, 24.0% of the total. On the other hand, 117 row-units and 58 semi-detached units were built, making up 5.6% and 2.8% of the total completed units respectively. Apartments and single detached homes exhibited strong growth versus the previous year, increasing by 44.3% and 34.7% respectively. On the other hand, completions for row units and semi-detached units declined by 33.9% and 35.56%.
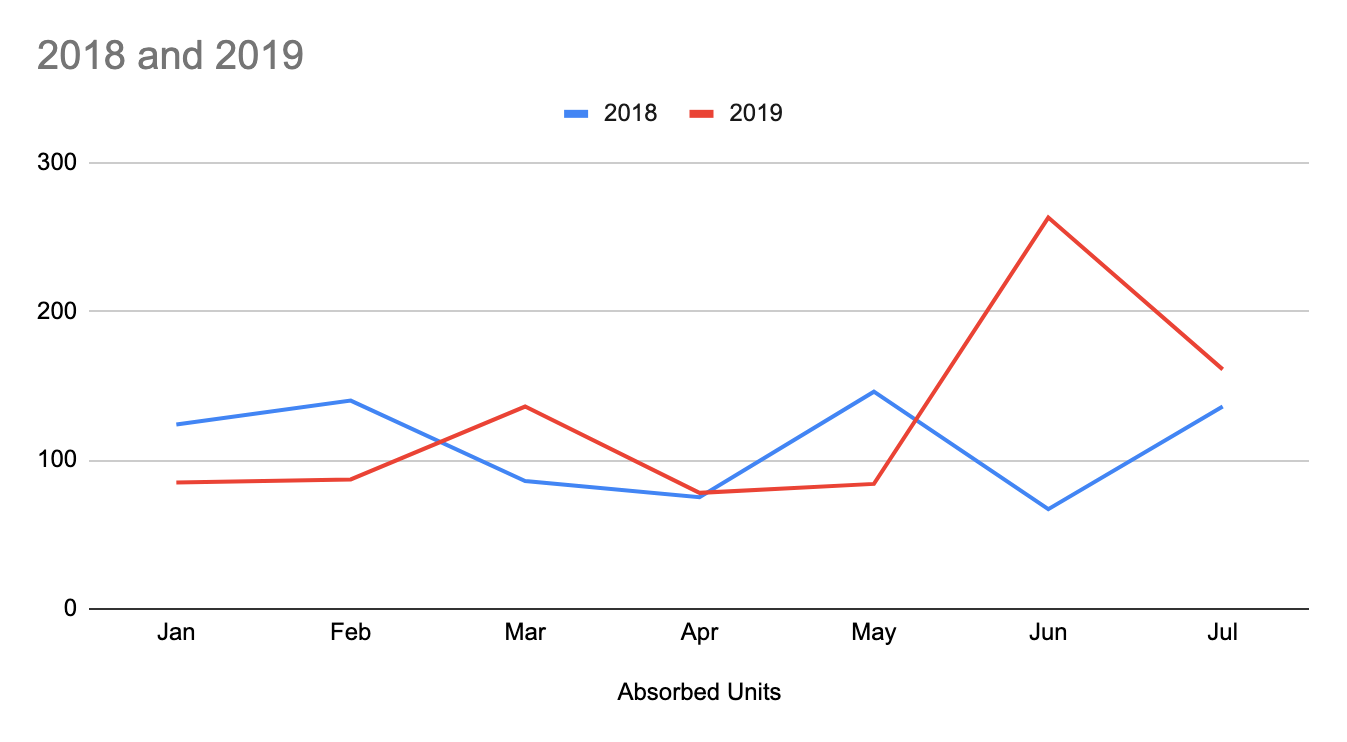
Absorptions
894 of the 2,100 units completed as of July of 2019 were absorbed by the market, representing a 15.5% growth in terms of units sold versus the previous year. The volumes of apartments and single-detached homes grew by 44.1% and 25.1% respectively, while take-up of row houses and semi-detached units dropped by 31.5% and 25.9%.
As of July 2019, 76.2% of units made available for sale were taken up. Apartments and single detached had absorption rates of 91.2% and 82.8%, respectively, while semi-detached and row house absorption was moderate at 60.0% and 48.8%.
Cap Rates
The past six quarters have exhibited relatively stable cap rates in Victoria across all asset classes, with the exception for Industrial Bs, whose yields compressed by 25 bps in the 2nd quarter of 2019, as rental growth resulted in downward pressure on cap rates.
Victoria’s cap rates remain in the upper-tier tier among cities, along with Vancouver, Toronto, Montreal and Ottawa. It has the lowest cap rates in Suburban B offices and neighbourhood retail, and 2nd lowest in Industrial B and in Power and Strip Retail. Downtown office cap rates range from 4.75% to 5.75%, while suburban offices range between 5% to 5.75%. High-rise and low-rise multifamily residential units have cap rates ranging from 3.25% to 3.75% and 3.5% to 4.5%, respectively.
Summary
Housing starts and issuance of building permits have generally been low compared to the previous year. The slowdown in activity is perhaps a reaction to the number of units the housing under construction inventory. In January of 2018, there were 4,114 units under construction. There have been more housing starts than completions throughout the year, as the number of units under construction consistently grew throughout 2018 reaching 5,776 units in December. The number of housing units under construction started to level off in the 1st quarter of 2019 and started to trend downwards after peaking at 6,235 units in April. There were 51.2% more houses under construction at this peak, compared to January 2018. We can expect that housing starts and building permit issuances should continue to be relatively low, especially with apartments, given the volume of units under development and completed.
The downward trend in the inventory of housing under construction coincides with the quickening of the pace of house completions, particularly during the 2nd quarter of 2019. The main driver of completions during this period, are apartments which comprised 78% of all housing units completed in the 2nd quarter of 2019. While this popular unit type had a healthy absorption rate at 91.2%, there seems to be a lot of completed apartments that will reach the market. There were 294 apartments reported to be absorbed, while 1,420 flats were declared as completed. It would be advisable to give particular focus on the inventory of apartments that will reach buyers shortly and how much of these can be absorbed by the market. The take-up for single-detached homes has been consistent throughout 2019. There have been 505 single detached homes completed in 2019, with 453 units absorbed.
