
Introduction
The housing prices in the region were at an all-time high this April as the residential real estate market recovered from its seasonal slump. Average prices across all housing types in April increased. Apartment-style condos saw a 14.3% rise to $339,426; townhomes appreciated by 5% at $405,013; and semi-detached house prices climbed nearly 8% to $433,949.
Even though housing prices were on the rise, home sales were dwindling as they dropped by 11% in 2018. The sales of homes in the tri-city in April saw a marginal 1.1% increase with 623 sales, as reported by the Kitchener-Waterloo Realtors Association. These sales are 2.2% higher than the 10-year average in the month of April. It was the townhomes that suffered a huge drop in sales by more than 15% compared to April of last year. Conversely, single-detached home sales rose by 15% year-over-year with over 390 properties sold.
The Kitchener-Waterloo-Cambridge market is a seller’s market as the supply of residential properties has dwindled. Inventory levels remained low in this area with only 884 homes available this April—a 6% year-over-year slide and a huge decrease from the 10-year average of 1,485 listings. The low-inventory, high-price scenario has made housing affordability an issue. Unemployment rose 0.2% year-over-year, however, despite this downturn, the region still continues to be spurred by the major multi-year investments in advanced manufacturing, like Toyota Canada and other companies aggressively taking advantage of the country’s new accelerated capital cost allowance incentives. This, in turn, will result in more employment opportunities for Kitchener-Waterloo residents.
Overview
Kitchener, Waterloo, and Cambridge (KWC) make up Southern Ontario’s tri-city. It is a promising metropolitan center surrounded by rural municipalities. Dubbed as “Canada’s Silicon Valley, the tri-city is home to various information technology companies such as BlackBerry Limited, OpenText, Kik Interactive, and Maplesoft.
Demographics
Population
With a recorded population of 523,894, KWC is the fourth largest metropolitan in Ontario behind Toronto, Ottawa, and Hamilton, and the tenth largest metropolitan in Canada, according to the 2016 Census Metropolitan Area (CMA). Of the total population, 67.8% belongs to the 15-64 age group, with the average median age at 39.2.
Its 2016 population increased by 5.5% based on census findings back in 2011. The number of residents registered in the Kitchener-Waterloo-Cambridge region is slightly higher when compared to the provincial and national averages, which are 4.6% and 5% respectively.
Employment
The unemployment rate in Kitchener-Waterloo-Cambridge, according to the Canada Real Estate Association, was 4.9% at the end of April 2019, up 0.2% from the previous month. The number of full-time jobs was up from the end of the preceding month. There were 1,000 more full-time jobs in April compared to March. A gain of 2,300 part-time positions led to an increase of 3,300 total posts in April. Full-time job gains occurred mainly in construction, manufacturing, and public administration.
Income
Better employment performance in the tri-city market may translate to better take-home pay in the workforce. As of the latest 2016 CMA report, the total income of individuals and households reached $423,860, with median total income at $35,709 and average total income at $46,844.
Education
The tri-city is home to local universities that help boost the metropolitan’s economy. Also, the 2016 CMA report showed that a large portion of the residents has good educational standing. Out of the total labor force in KWC, 28.9% reached secondary high school or equivalent level, 52.8% attained a post-secondary diploma or degree, 15.6% have a bachelor’s degree, and at least 4.8% graduated with a master’s degree. A significant portion of the population also earned a degree in medicine, dentistry, veterinary, or optometry.
Among the universities, those with the most significant student populations are from the University of Waterloo, Wilfrid Laurier University, and Conestoga College.
Economic Performance
Kitchener-Waterloo-Cambridge continues to perform well and outshine its neighbouring regions, thanks to its standout manufacturing and education industries. Other significant anchors of the tri-city’s economy include research and development, manufacturing, retail, technology, agriculture, and healthcare.
Vacancy Rates
According to the Canada Mortgage and Housing Corporation, the overall vacancy rate in this region increased from 1.9% to 2.9% over the past year, mainly due to an increase in total supply that outpaced the growth in demand. In rentals alone, more than 1,600 units were built in 2018.
Home Prices
According to the Kitchener-Waterloo Association of Realtors (KWAR), the $529,800 average sale price of all residential properties sold in April was a 10.9% appreciation from April 2018. Detached homes sold for an average price of $611,803, an increase of 7.6% compared to April of last year. During this same period, the average sale price for an apartment-style condominium was $339,426—an increase of 14.3%. Townhomes and semis sold for an average of $405,013 (up 5.3%) and $433,949 (up 7.7%), respectively.
“Average sale prices hit an all-time high in April,” notes Brian Santos, President of KWAR. It’s only the third time the overall residential sale price has exceeded half a million, and for the first time, the average cost of a detached home climbed over the 600-thousand-dollar mark.
Likewise, median prices reached an all-time high in April. The median price of all residential properties sold last month increased by 11.4% to $490,000, and the median price of a detached home during the same period increased by 11.1% to $568,500.
Housing Cycle
Building Permits
Quantity of Building Permits
The year 2019 in Canada’s silicon valley tri-city, Kitchener-Waterloo-Cambridge, opened with a total of 949 issued building permits—a 32.50% decrease from the previous quarter’s figure. The first quarter was also 22.28% less than the 1,221 building permits issued in the first quarter of last year.
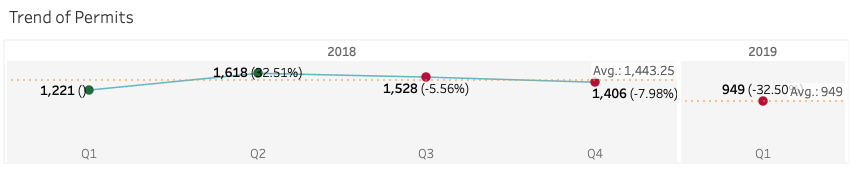
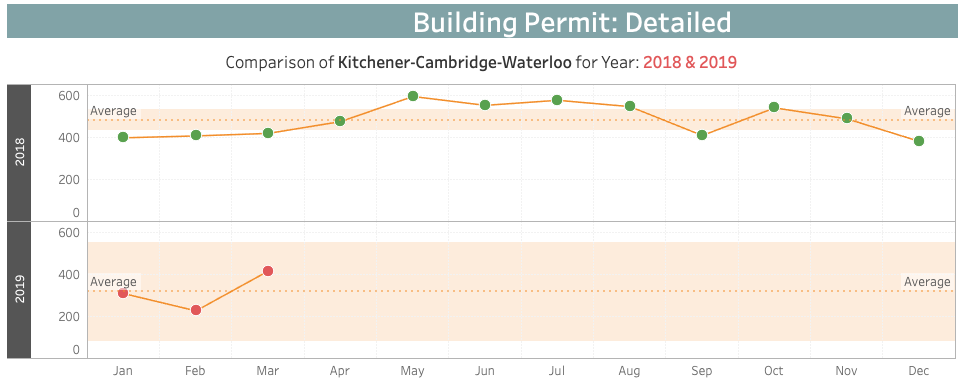
As for the monthly comparison, all months exhibited a far less impressive performance this year compared to last year. The onset of 2019 experienced a decrease of issuances by 22.42% compared to 397 building permits released in January of 2018. The 308 building permit issuances in January were also 18.95% lower compared to the previous month’s 380. The downward trend continued in February, with only 226 permits issued—a staggering 44.33% decrease from the 406 issuances in February of last year. The month of March, luckily, picked up the slack by 84.44%, with 189 more building permits issued than the previous month. Despite this increase, March’s 415 total of issuances was just -0.72% lower than the 418 permits in March of last year.
Value of Building Permits
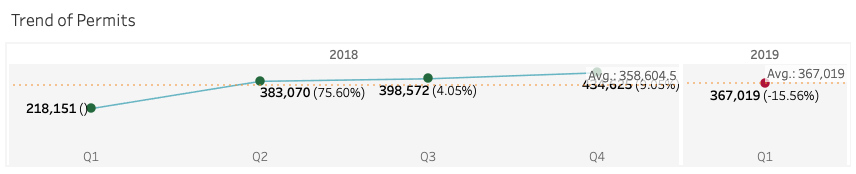
For this year’s first quarter, the building permits issued were valued at $367,019—a 15.56% decrease from the previous quarter’s $434,625, but a 68.24% increase from the $218,151 worth of issuances recorded in the first quarter of 2018.
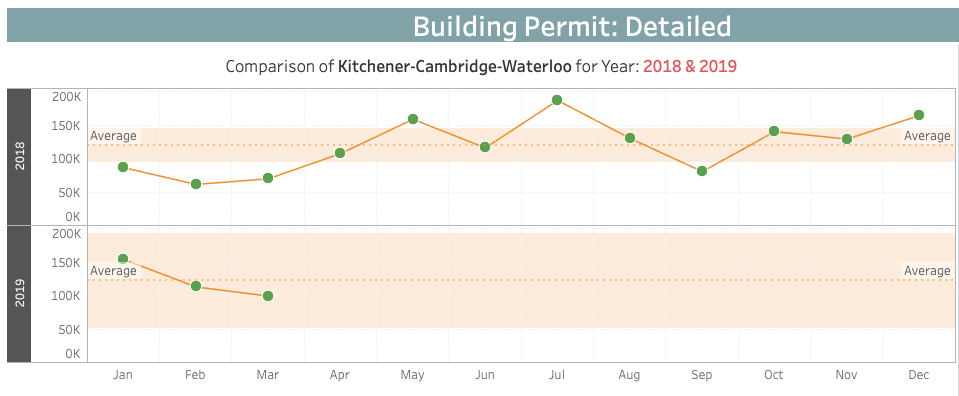
As for the monthly observations, the value of permits issued in January 2019, totalling $154,369, decreased by 6.24% from the previous month, although it is 78.13% higher compared to the same month of last year. The value of permits continued to slide down to 26.67% in February, with only $113,205 worth of building permits despite the increase in issuances. However, the number of issued building permits recorded in February 2019 is still 83.95% higher than that of February 2018. This opposing trend seems to be observable again in the following month, where permits amounted to $99,445 (a 12.15% slide from February’s numbers). However, the value of March’s permits is still 42.17% higher than the $69,946 recorded in the same month of last year.
Housing Starts
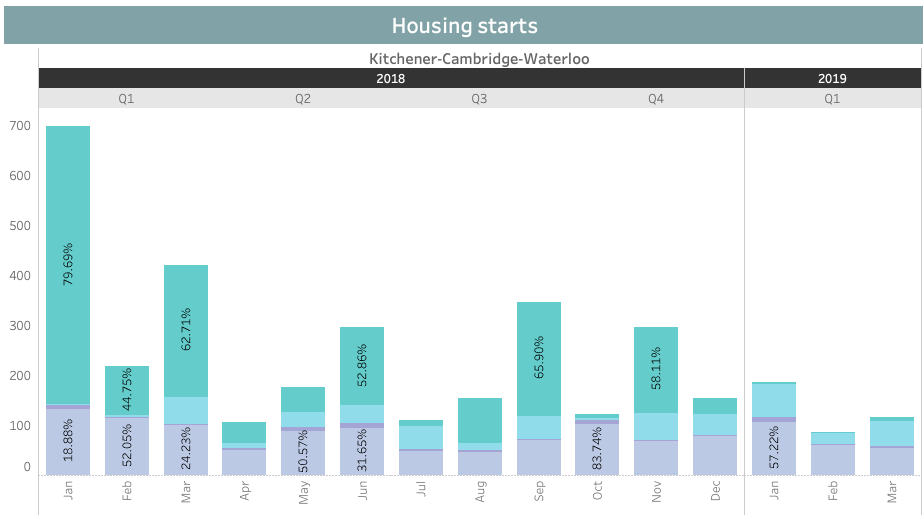
Kitchener-Waterloo-Cambridge opened 2019 with 187 units in housing starts—a 73.2% slip from January 2018’s 669, but a 21.43% ascent from the previous month’s 154. At 107 units, a big chunk (57.22%) of the total housing starts consisted of single-detached houses. Row units came in second with 66 starts, comprising 35.29%. Only 10 of the housing starts that made up 5.35% of the total housing starts were classified as semi-detached unit types.
In February, single-detached houses took up 72.41% of all housing starts. These housing types waned from 107 to 63 units—a 41.12% decrease from the previous month.
It was not only single-detached houses that saw a slump in housing starts. The housing starts of row units decreased by 63.64%—from 66 to 24 units—and no housing starts could be seen from semi-detached structures, apartments, and other housing types. Overall, February housing starts were reduced by half (53.48%) with only 87 units in total.
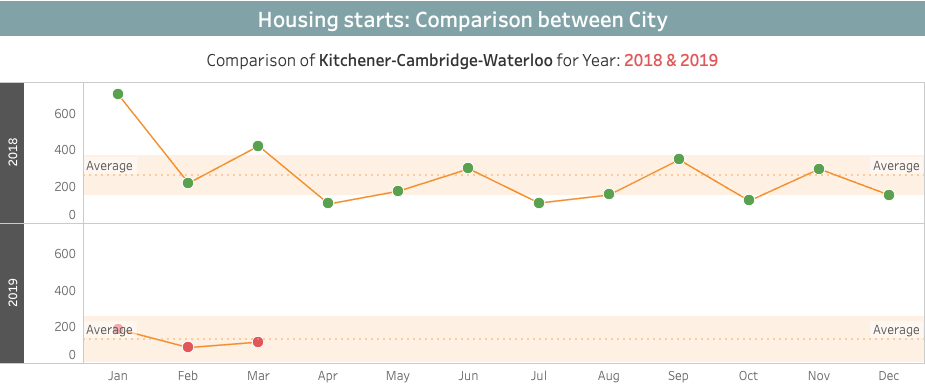
This downward trend didn’t continue in March, however. Housing starts increased by 34.48% with 117 units, single-detached homes contributing nearly half (46.15%). The month also saw a few housing starts in apartments and other types of housing units. Though this segment makes up only 7.69% of the total housing starts in March, it still contributed 9 more than the previous month’s 0.
Overall, this quarter’s housing starts totalled 391 units—a 70.80% collapse from the 1,339 total units recorded in the first quarter of 2019. Unlike 2018’s Q1, when apartment and other unit types dominated the majority (68.63%) of housing starts, most of this quarter’s housing starts were of single-detached units (57.29%). This quarter’s total was also a 31.76% decrease from the previous quarter’s 573 housing starts.
Housing Under Construction
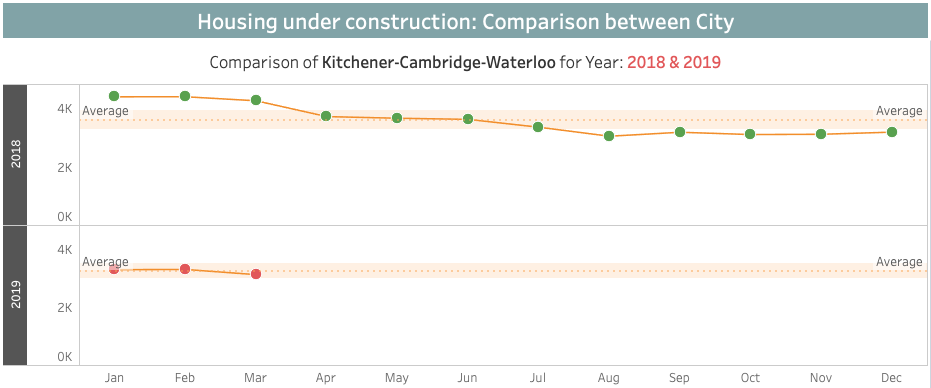
Averaging approximately 3,604 units per month, the number of houses that were under construction in Kitchener-Waterloo-Cambridge was on a slow downward trend throughout 2018. The first quarter averaged 4,369 units per month, February leading with 4,416 units. This quarter also had the highest number of housing under construction (13,107), taking up 30.31% of the total houses being built in that year.
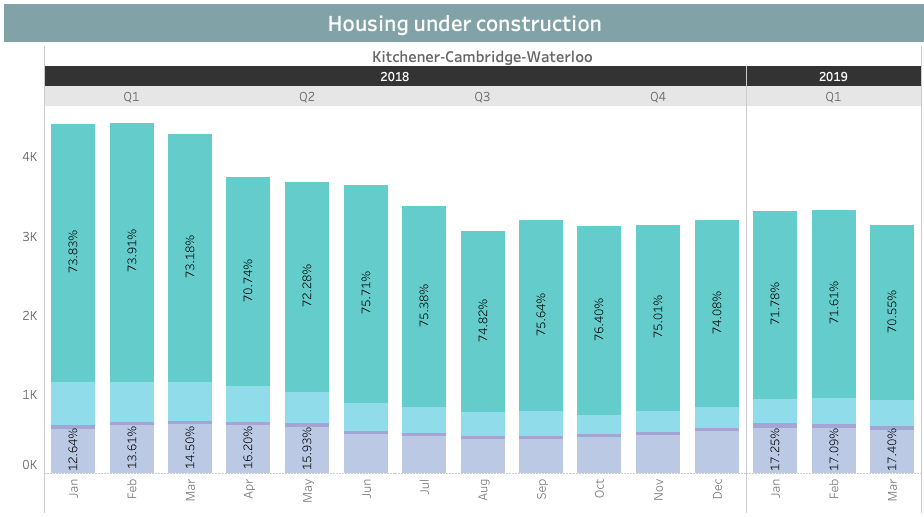
In 2019, the number of constructions in the first three months were all below the previous year’s performance: 25.01% in January, 24.86% in February, and 26.631% in March. Overall, the housing constructions in the first quarter of 2019 increased slightly by 3.34% in comparison to Q4 of 2018 but decreased by 25.49% compared to last year’s first quarter.
Along with the housing starts in the tri-city, issued building permits are starting to slow down as well. Although the houses under construction were higher this quarter, the increase was just a minimal 3.34% and still was not at par with the performance of the same quarter last year. Similar to absorptions, housing completions continued to decrease in number.
Although the housing starts were far fewer compared to the issued building permits this year, the demand for homes still exists. This is evidenced by more than half of the houses in the KWC region being absorbed in this quarter. It may seem contradictory, considering the slowing trend in many parts of the housing cycle, but the market in KWC is rising. The number of housing constructions has already picked up this quarter, which means that there will be more housing completions in the next few quarters. The absorption rates tell us that the demand is still existing in the area, considering its recent economic development after being dubbed as the “Silicon Valley of Canada.” We can expect steady, perhaps even higher, absorptions, which will then result in higher home prices in this tri-city. This event will most likely encourage real estate investors to make more developments in the area, where we can expect a surge in building permit issuances and housing starts. This period in KWC is optimal for investing in properties, especially rental units.
Housing Completions
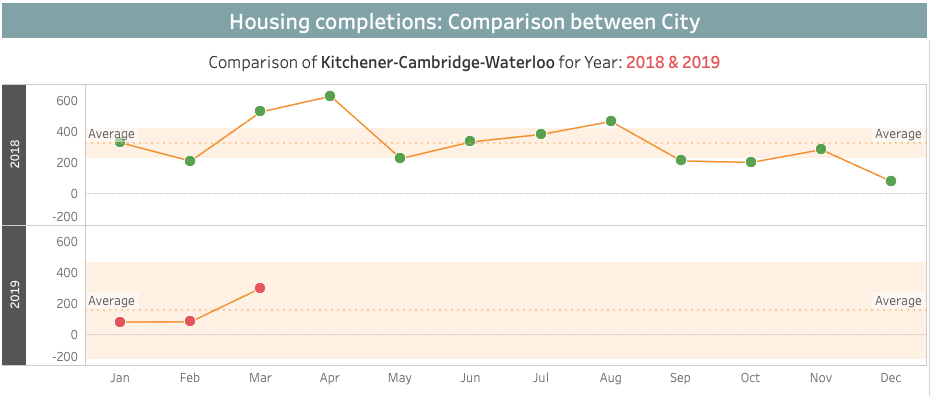
Housing completions for the first quarter this year, which totalled 454, saw a modest decline of 19.78% from last quarter’s 566 completions.The single-detached units prevailed over other housing types, contributing 44.49% of all houses completed during this period. There were only 65 completed row-unit homes this quarter—a 56.08% downturn from the previous quarter’s 148 units, and 52.90% lower than the first quarter of 2018. Aside from that, apartment and other unit types also suffered a steep 76.08% decline—from Q1 2018’s 715 units to Q1 2019’s 171 units.
And yet, with 297 total completed units, March had the most completions and indicated a recovery. At 57.58%, most of these completions were apartments and other housing types. Single-detached houses contributed 25.25%.
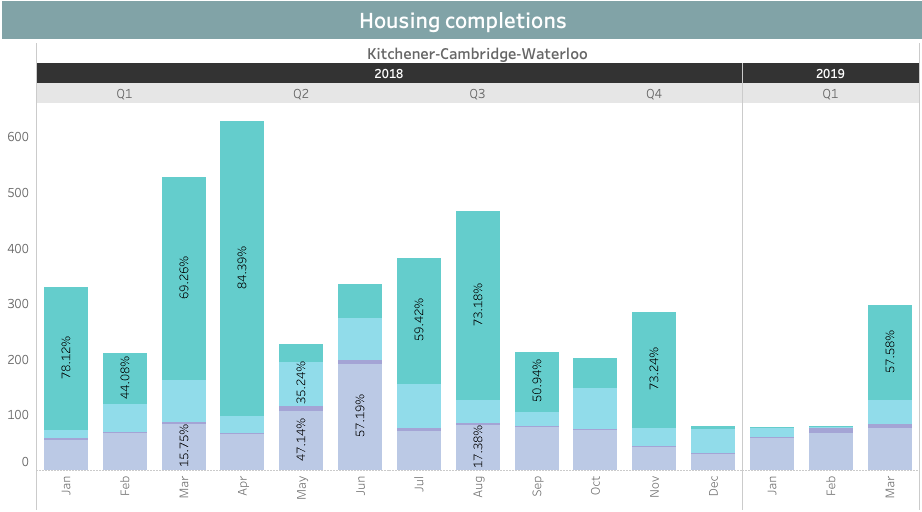
The monthly completions this year fell way below last year’s performance. January 2019 was the most depressed, recording only 78 completions—76.29% lower than January 2018’s performance and just 2.50% lower than that of December 2018. Conversely, housing completions in March 2019 picked up tremendously by 275.95% compared to the previous month. Overall, the 454 completions of this quarter were 42.55% lower than the 1,067 completions of the same quarter last year.
Absorptions
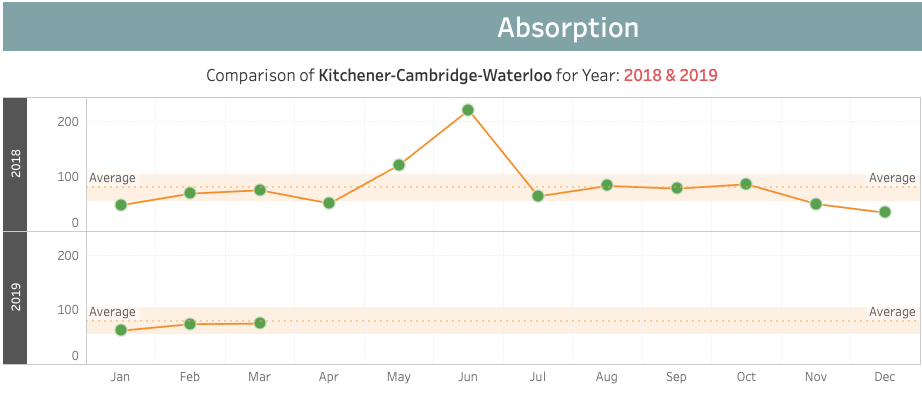
The absorptions in Q1 2019 followed the trend of absorptions in the same period last year. With 211 total units absorbed compared to 144 in Q1 2018, this quarter saw a 46.53% appreciation. The absorptions in the first three months of this year performed better than the same period of last year. The 62 absorbed units in January were a 29.17% improvement on the 48 absorptions recorded in the same month of the previous year. The next two months saw an upward trend; February saw a 19.35% increase from January, and March grew by an additional 1.35%. Moreover, the 74 absorbed units in February were 7.25% higher than the 69 absorptions of the same month last year. However, March absorptions of this year saw no change from March 2018’s 75 units.
Summary
The dwindling of permit issuances started in the 3rd quarter of 2018 and has continued through 2019. With only 949 building permits issued in Q1 2019 as opposed to the previous quarter’s 1,406 and Q1 2018’s 1,221, issuances were at an all-time low this quarter compared to all quarters of last year. This downtrend is also seen in all other parts of the housing cycle, except for housing constructions, which saw an increase. With only 391 units, housing starts were also at their all-time low this quarter. During this period, only 454 residential properties were completed, and only 255 were absorbed. These drops accounted for 36.40% to over 70% of decreases in quantity compared to the same quarter of the previous year. Conversely, the first quarter of 2019 had more houses under construction with 9,766 units compared to the previous quarter’s 9,450 units. However, Q1 2019’s number is still a 25.50% drop from Q1 2018’s.
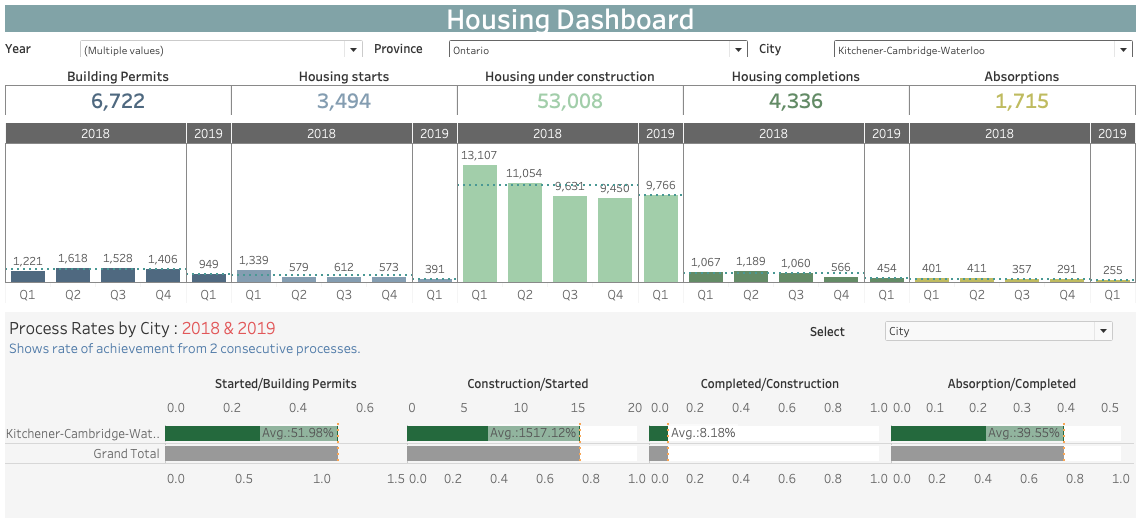
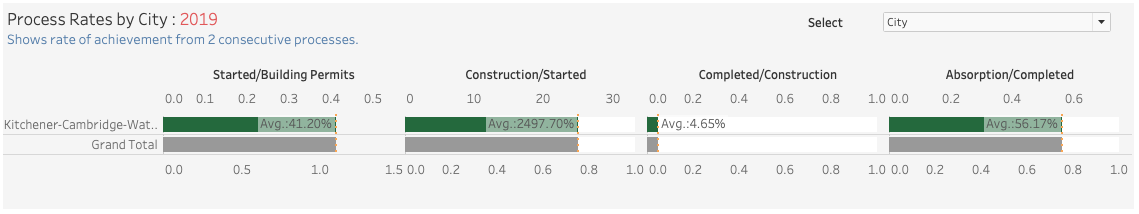
We can see that in the first quarter of 2019, there were less housing starts (41.20%) than the number of issued building permits. Housing constructions surpassed housing starts more than 20 times (a whopping 2,497.79%), and yet, compared to these constructions, the completed units only account for 4.65% this quarter. And with these completions, 56.17% were absorbed in the market.
Analysis
Along with the housing starts in the tri-city, issued building permits are starting to slow down. Although there were more houses under construction this quarter, the 3.34% increase was minimal and still did not put Q1 2019’s performance at par with that of Q1 2018. As for housing completions and absorptions, they continued to dwindle.
Although there were far less housing starts than issued building permits this year, the demand for homes still exists; absorptions in the Kitchener-Waterloo-Cambridge area have been increasing, with more than half of the houses absorbed this quarter.
It may sound contradictory, considering the slowing trend in many parts of the housing cycle, but the market in KWC is rising. The number of housing constructions has already picked up this quarter, which means that there will be more housing completions in the next few quarters. The absorption rates tell us that the demand still exists in the area, considering its recent economic development after being dubbed as the ‘Silicon Valley’ of Canada. We can expect steady (perhaps even higher) absorptions, which will then result in higher home prices in the tri-city. This event will most likely encourage real estate investors to make more developments in the area, where we can expect a surge in building permit issuances and housing starts. This period in KWC is optimal for investing in properties, especially rental units.
