Edmonton Overview
Edmonton is known as the “Gateway to the North.” It is the capital of Alberta incorporated as a city in 1904. It is the oil capital of Canada as the city is the staging point for large-scale oil sands projects occurring in northern Alberta and large-scale diamond mining operations in the Northwest Territories. Edmonton is located on the North Saskatchewan River with proximity to the geographical centre of the province. It has a strategic area situated on an economic divide just right between the highly-productive farmlands of Alberta and in northern hinterland.
Demographics
Population
Edmonton is Alberta’s second largest city and the fifth largest municipality in Canada. As of 2016 Census of Population, Edmonton had a total population of 932,545. This showed an increase of 14.8% from the population in 2011 of 812,201. Edmonton is also ranked as the sixth largest census metropolitan area (CMA) in Canada. 70.3% belongs to 15 to 64 years old. The average age is 37.7 years old while the median age of the population is 35.7 years old.
Income
The uncertainty around the logistical issues faced by the oil industry in Alberta remains to stave off future investment in energy infrastructure spending. This could dampen future investment and result to put pressure on employment prospects for Edmonton. Much of Edmonton’s employment prospects, as well as income levels, are closely tied to the energy sector. While the GDP figures showed healthy signs of recovery for Edmonton in 2018, they are projected to hold relatively steady at 2.1% in both 2019 and 2020.
While the debt to income ratio in Canada remains mostly unchanged over the last two years, Edmonton and Calgary have seen some of the most significant changes year over year, -8.3 and -7.9 respectively. The declines in Edmonton and Calgary’s ratios were largely as a result of income growth.
Economic Standing
Employment
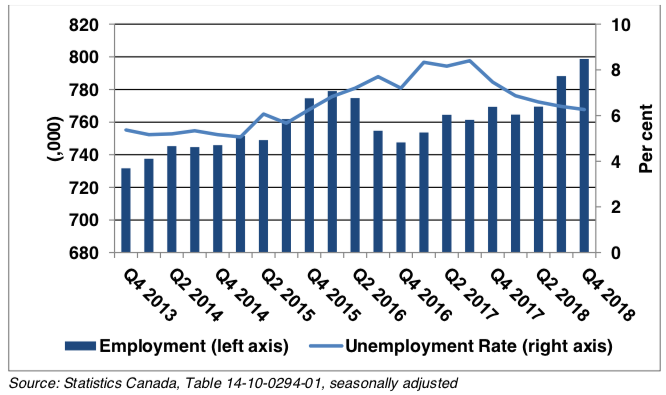
For the first quarter of 2019, employment in Edmonton is expected to see growth with professional services, manufacturing and financial service sectors leading the way. All signs look positive from an employment standpoint including the following notable measures for the fourth quarter of 2018:
- Q4 of 2018 saw an increase of 29,300 positions compared to the same quarter in 2017
- Q4 of 2018 witnessed a decline in the unemployment rate from 7.5% to 6.3% year over year
- Q4 of 2018 saw average weekly wages increase by 1.7% year over year
The unemployment rate is now below the provincial average of 6.7% and is expected to remain near this level for the first two quarters of 2019. As the local economy in Edmonton is recovering from the lulls of 2016, a positive net migration back into the city should be spurred by the recent positive measures in economic standing.
Employment in Metro Edmonton
Gross Domestic Product
Real GDP is expected to be slightly lower for 2019 at 2.6% down from an estimate of 2.8% in 2018. As a substantial portion of Alberta’s GDP is attributed to the oil and gas sector, growth for 2019 is expected to continue as long as oil prices stay above $55 USD. However, there is uncertainty in the market when it comes to energy infrastructure projects as energy prices are predicted to be volatile over 2019. This could have impending negative ramifications for the economy as it has historically followed the rise and fall of energy prices.
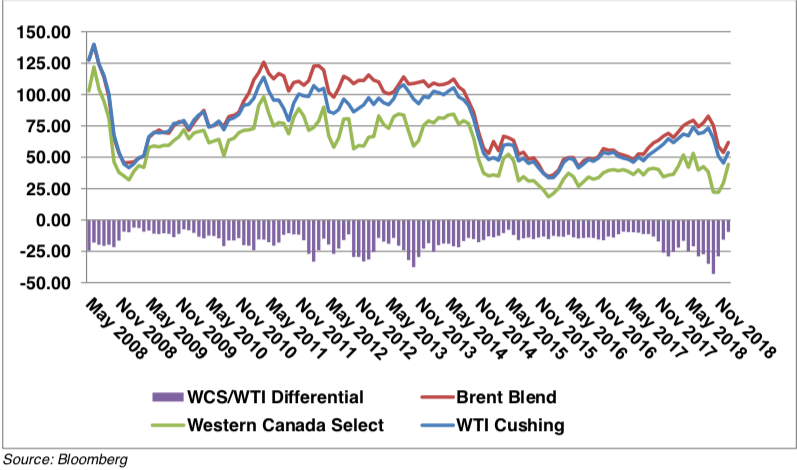
Another compounding factor is the widening gap between Western Canadian Select (Alberta’s oil benchmark price) and WTI. As the pipeline capacity is peaking, excess production beyond the existing pipeline’s capacity measures means Alberta’s oil prices are sold at a discount. While WTI prices may increase, a positive correlation does not necessarily ensue between Alberta’s benchmark price and that of WTI. This is a chokepoint for the future of Alberta’s energy projects given the lack in infrastructure capacity to transport oil out of province.
Inflation
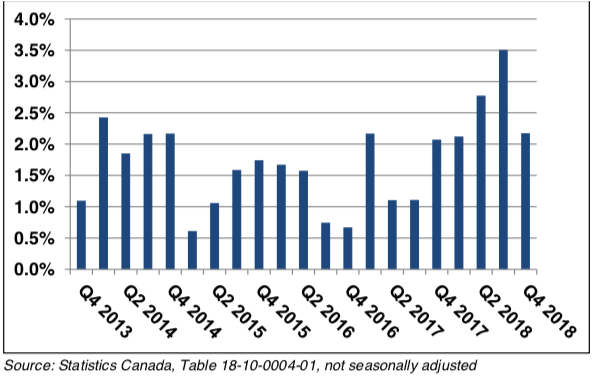
The inflation rate is expected to hold above 2% throughout 2019. A decline in energy-related prices and the easing of pressure on rents and home prices will help keep inflation relatively stable throughout the balance of the year. The lower inflation rate will help preserve the real value of incomes and should spur consumer spending in turn.
CPI Inflation Rate in Metro Edmonton
Real Estate Trends
Housing Summary
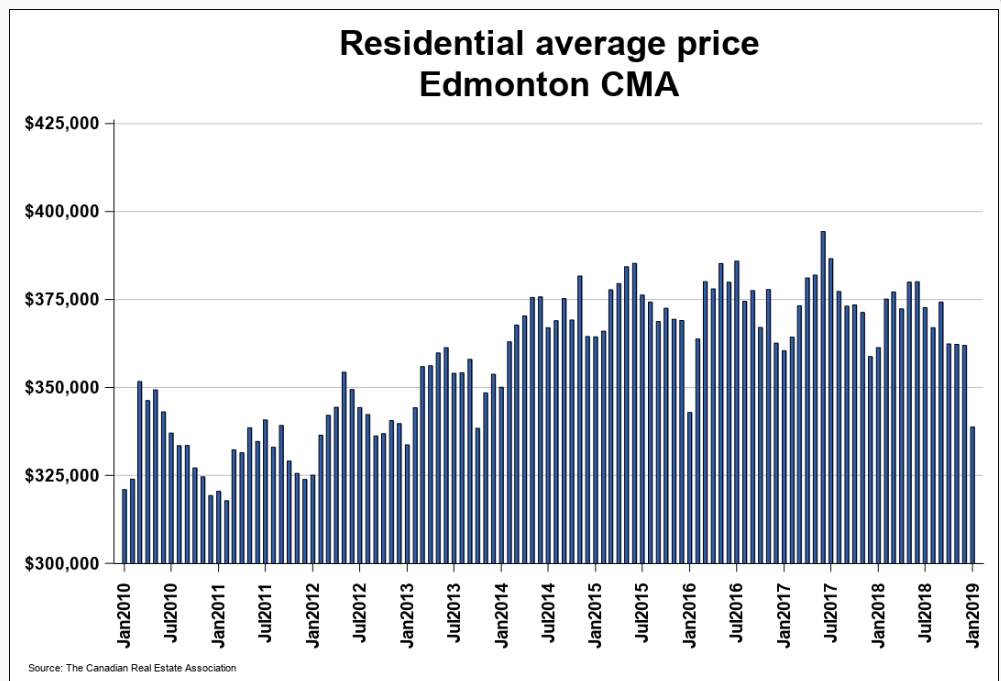
According to the Realtors Association of Edmonton, year over year sales figures has declined across all housing sectors with duplex/rowhouses seeing the steepest decline of 9.6%. The total residential industry saw a year to date sales decline of 11% compared to February 2018.
Inventory remains high, growing further compared to last year and the number of listings continues to decrease, falling 8.5% in February year over year. Additionally, the days on market figure is nine days longer compared to February of 2018
Vacancy Rates
Edmonton’s vacancy rates in the rental sector remain relatively high compared to the 1.4% low of 2013 when the economy was in stronger shape. However, there is a significant improvement with a 5.3% rate, a decline from the over 7% figure in October of 2017.
While this is an improvement, it still holds a negative impact on the multi-family sector and the oncoming inventory under construction concentrated in the apartment sector. This further reduces the incentive for developers to start construction on multi-family projects with a large pending supply.
Building Permits
The total residential and non-residential building permits for metro Edmonton amounted to approximately $1.1 billion in the fourth quarter of 2018, representing a decline of 13.1% year over year. While the quarter-over-quarter figures saw a positive change of 7.1%, construction intentions were weaker when compared to the previous year.
Values of permits for the residential sector saw a drop of 22% in the fourth quarter of 2018 compared to the same quarter in the previous year. Single dwelling units witnessed the steepest decline in permit values year over year with a 32% drop. Calgary’s building permit values did not bode well either but were more favourable when compared to Edmonton. Compared to all municipalities across Canada, permit values were up 4% in the fourth quarter across Canada and nearly 5% compared to the previous year.
Housing Starts
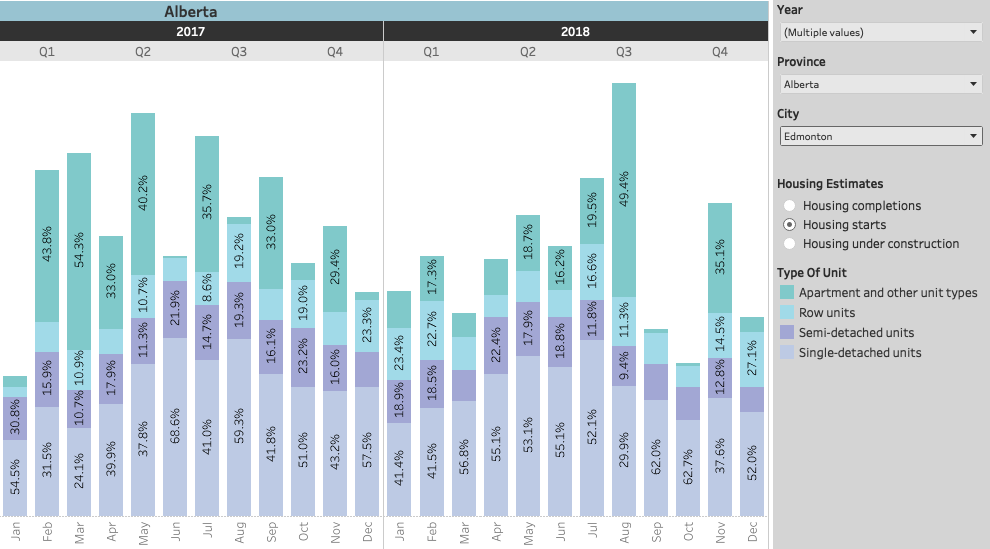
Total housing starts were up 4.3% in the fourth quarter of 2018 compared to the previous year. The increase was primarily attributed to the multi-family sector as single-family housing starts were almost 13% lower in the fourth quarter of 2018. A drop in single-detached housing starts in the fourth quarter of 2018 weighed down the total housing starts for Edmonton with a lesser demand.
Higher starts in the multi-family sector in the last two months of 2018 helped pull up total housing starts and make up for the losses attributed to the single-family sector which showed a negative trend year over year stemming back to August of 2018 ranging between a 27% decline in August to a 19% decline in December.
Under Construction
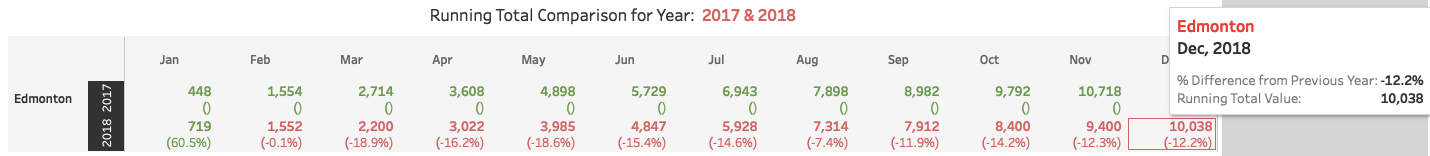
The overall housing units under construction as of December 2018 was at 9,952, short by 4% against last year’s total for the same month. Year over year, housing projects have reached 10,897 for August which corresponds to 9.02% increase. As reported by the Edmonton Journal, the city’s housing market inventory in 2018 reached a 10-year high bringing the year-end total to just above 124,000.
There were just over 10,000 units completed or 8.1% compared to the vast number under construction representing an onslaught of pending inventory coming downstream which should bring ample supply to the market in 2019.
The completion of a number of major construction projects in the Edmonton region will lead to further contraction in the building sector. This will result in a loss of many full-time jobs in Edmonton that would in turn limit demand for residential housing growth.
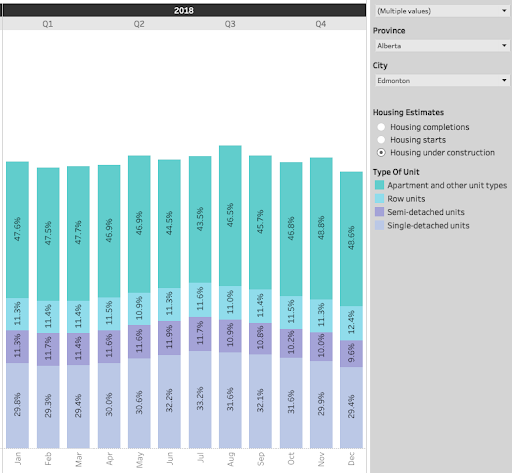
Apartments make up for the majority of the glut in inventory representing nearly 50% of the inventory under construction.
Completions
There is a surplus of completed projects in Edmonton adding up to the ballooning inventory of the city. The overall number of completed housing units for the fourth quarter of 2018 saw 2,663 units compared to 2,126 in the same quarter of the previous year. December saw the largest contribution with a total of 1,087 units with apartments showing a 31% increase year over year.
Majority of the completed projects are single-detached units that comprise nearly half of the total completions in December.

Absorption Rates
Year over year, the absorption of housing units in Edmonton witnessed a healthy rise with 5,021 units being absorbed in the fourth quarter compared to just 3,202 in the same quarter of 2017.
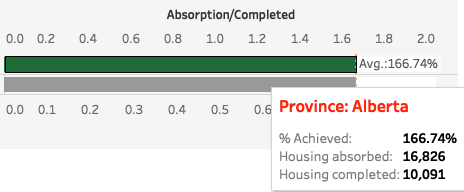
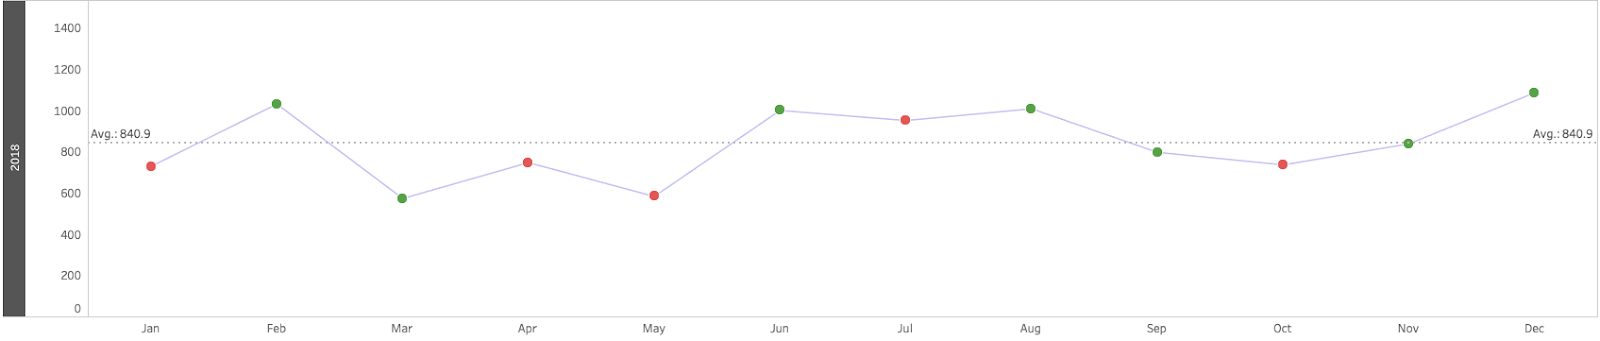
Out of 10,091 completed units in 2018, 16,826 were absorbed resulting in a 167% absorption rate. Overall, the absorptions are maintaining a steady upward trend with a strong close towards the end of 2018 with a 63% increase in absorptions in December compared to the same month in 2017.
As you may see in the graph below, the number of absorptions averaged out to just slightly above 1,400 for 2018 whereas 2017 saw only 1,033 units absorbed.